Measurement · Benchmarks
What is a good ROAS?
A good ROAS is the one that clears your gross margin: break-even is 1 divided by that margin, so a 40% margin needs 2.5. The number nobody publishes is the second one. Below roughly 50 conversions per period, most of the ROAS swings you react to are counting noise, not performance.
Everyone answers this with a number.
Ask the question anywhere and you get 4x, or you get a table of industry averages, or you get "it depends" followed by a shrug.
There are actually two numbers here. The first is arithmetic and takes ten seconds. The second decides whether the first one is even readable in your account, and almost nobody checks it.
The second one is the reason a client can hand you a ROAS target that your account has no way to hit or miss on purpose.
Or see what your team should look at first: the Paid Media Capacity Check, being built nowWhat is a good ROAS, in arithmetic?
A good ROAS is one that clears your gross margin with room left over. Break-even ROAS is 1 divided by your gross margin. A 40% margin breaks even at 2.5. A 70% margin breaks even at about 1.43. That number belongs to your business, and no industry average knows your cost of goods.
Two columns are worth having written down before anyone sets a target:
| Gross margin | Break-even ROAS | ROAS to keep 10% of revenue | What this means for you |
|---|---|---|---|
| 20% | 5.0 | 10.0 | Paid acquisition is brutal here. Retail, distribution, thin-margin ecommerce. A 4x that everyone calls great is a loss on every order |
| 30% | 3.33 | 5.0 | Tight. The gap between break-even and profit is narrow, so a small measurement error changes the verdict |
| 40% | 2.5 | 3.33 | The typical DTC shape. This is where "aim for 3" comes from, and it is only right at this margin |
| 50% | 2.0 | 2.5 | Room to buy growth. You can run at 2.2 for volume and still be adding contribution |
| 70% | 1.43 | 1.67 | Software, info products, most services. A ROAS of 2 is strong here and would be a disaster at 20% margin |
| 85% | 1.18 | 1.33 | ROAS is close to the wrong metric. At this margin the binding constraint is payback period and lifetime value, not the ratio |
One trap in that table. "Gross margin" has to be the margin after every variable cost that scales with an order: cost of goods, shipping, payment fees, and the returns you actually get. Use the accounting gross margin and your break-even point comes out lower than the one your bank uses.
The second trap is the target itself. If you want to keep 10% of revenue as contribution after ad spend, the ROAS you need is 1 divided by (margin minus 0.10). At a 30% margin that is 5.0, not 3.33. People set the break-even number as the target and then wonder why a profitable-looking account produces no money.
Or see what your team should look at first: the Paid Media Capacity Check, being built nowWhy can't an industry benchmark answer this?
Because a benchmark averages accounts with different margins, different price points, different attribution settings and different definitions of a conversion. Two shops reporting the same 3.0 can be one printing money and one dying quietly. The average cannot see which, and neither can you from the outside.
There is a second problem underneath, and it is the bigger one. The ROAS on your screen is not a fact about your business. It is a fact about a measurement configuration: which conversion counts, which attribution model, which lookback window, and which date the revenue lands on. Change any of those and the number moves without a single thing happening in the account. That is the whole argument in marketing attribution: why every tool gives you a different number.
So a benchmark is comparing your configuration to somebody else's, and calling the difference performance.
The third problem: which ROAS are you even comparing?
The third problem is scope. Platform ROAS divides the revenue that platform claims by the spend on that platform. Blended ROAS, sometimes called MER, divides all revenue by all marketing spend. Only the second one can be checked against the bank, because no platform can double-count it. If a client gives you a target, find out which of the two they mean before you agree to it.
And some campaigns do work that their own number cannot capture. An operator in r/FacebookAds put it plainly in August 2026. His traffic campaign looked terrible judged on direct purchases. The retargeting pool it built was the only reason the later sales campaigns made money. His fix was to stop reading ROAS on that campaign, not to measure it better. That is often the right call. Worth saying out loud, though: it means giving up on measuring something, not measuring it well.
Can your account tell a good ROAS from a bad week?
The smallest difference your account can detect is the number nobody publishes, and it is the one that changes how you work. Conversions arrive as a count, and the random spread of a count scales with the square root of that count. So the smaller your conversion volume, the bigger a ROAS difference has to be before it means anything at all.
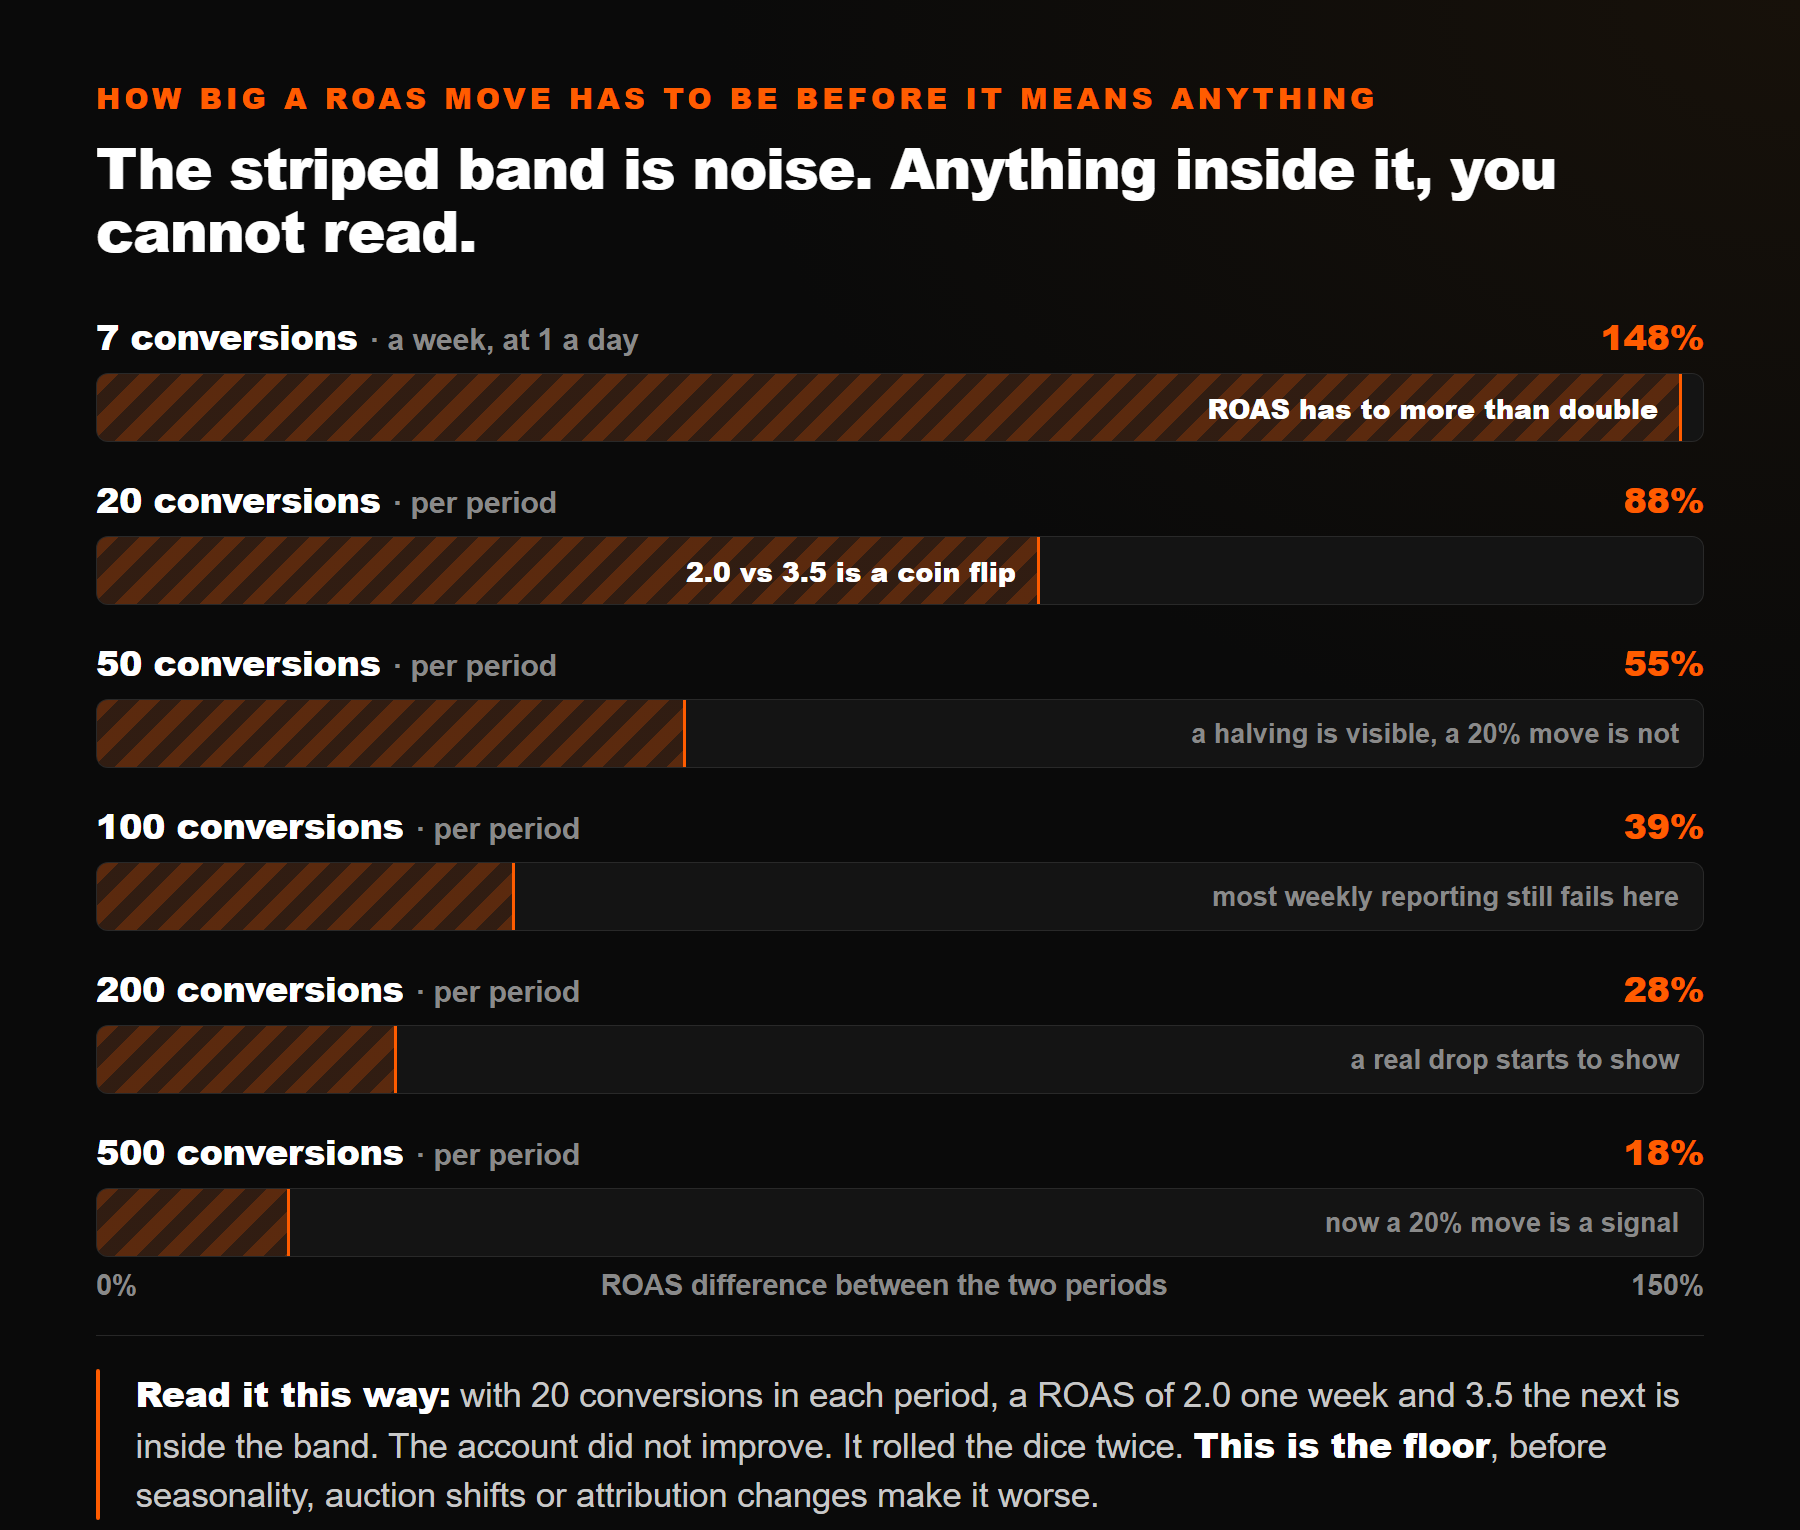
The arithmetic, so you can check it
The rule of thumb behind the picture, so you can check it rather than trust me. For two periods with about N conversions each, the smallest relative difference you can distinguish is roughly:
Smallest readable ROAS difference, as a fraction
| Conversions in each period | If every order is the same size | With normal order-value spread | What you can honestly conclude |
|---|---|---|---|
| 7 (one a day) | 105% | 148% | Nothing. ROAS would have to more than double before you could call it a change |
| 20 | 62% | 88% | Only a collapse. 2.0 against 3.5 is a coin flip, and that is the swing people restructure accounts over |
| 50 | 39% | 55% | A halving is visible. A 20% move still is not. This is where most small accounts live |
| 100 | 28% | 39% | Big moves only. Most weekly client reporting is built on differences smaller than this |
| 200 | 20% | 28% | A real drop starts to show in the same week it happens |
| 500 | 12% | 18% | Now a 20% move is a signal. This is the volume at which weekly ROAS reporting earns its place |
What that means at your conversion volume
Read the middle rows again, because they are the uncomfortable ones. An account doing 100 conversions a fortnight cannot distinguish a 30% ROAS difference from chance, and 30% is a much larger move than anything most weekly reviews are reacting to.
Two honest caveats before you quote these numbers
Two honest caveats, before anyone quotes these numbers at a client.
That threshold is a floor, not the real band. It assumes the two periods differ only by chance. Seasonality, an auction shift, a competitor or a tracking change all make it worse, and none of them are in the formula.
The order-value spread is also a guess unless you compute it from your own data. Tight, similar order values narrow the band. A handful of large orders widen it a lot.
What do Google and Meta say you need?
Both platforms publish a minimum volume, and both minimums get borrowed as if they answered this question. They do not. They describe what the machine needs to learn, which is a different and much lower bar than what you need to read a difference.
“At least 15 conversions in the past 30 days at the conversion tracking level.”
Google Ads Help, About Target ROAS bidding (retrieved 5 August 2026). It is the threshold to switch the strategy on for Search and Shopping, not a threshold for reading results.
Meta's side of it is the learning phase. Its documentation puts the threshold at around 50 optimisation events in a 7-day window per ad set. An ad set unlikely to reach that gets flagged as learning limited.
Put those minimums next to the table
Now put those next to the table. At 15 conversions in a period, the smallest ROAS difference you can read is around 100%. So Google's minimum for switching Target ROAS on sits at a volume where your ability to judge the result is close to zero.
Both statements are true. One is about what the bidder needs to optimise. The other is about what you need to conclude anything. The gap between them is where a lot of bad decisions get made.
Meta's 50 is the more useful of the two to steal, for a reason that has nothing to do with bidding. It lands near the volume at which you can see a halving. If you wanted one rule of thumb, 50 conversions per review window beats any ROAS benchmark.
Or see what your team should look at first: the Paid Media Capacity Check, being built nowWhat this cost me to learn
Two things, and one of them was expensive.
In 2025 I spent more than 10,000 euros of my own money on ad management platforms. Not a client's money. Mine. What they gave back was the commentary Google and Meta already show you inside their own interfaces, plus generic rules applied identically to every account.
Not one of them ever told me the thing on this page. None said the account had no volume to answer the question I was asking it. They were happy to draw me a ROAS trend line at nineteen conversions a month.
The second lesson, and the cheaper one
The second lesson is smaller and more embarrassing. In Google Ads change history I admitted my before-and-after window was 14 days a side, that 14 was a guess, and that I had no principled way to set it. This is the answer I settled on. Set the window by conversion count, not by calendar. Wait for 50 conversions on each side, then compare, however many days that takes. If it takes six weeks, that is the honest reading speed of the account. Shortening it does not make you faster. It makes you wrong more often.
How much any of this matters scales with the budget, and I would rather say that than pretend otherwise. On an account spending 300 euros a month, most of what you press barely moves anything. At 5,000 or 10,000 a month you need to know exactly what you are pressing and why. That is also the range where the volume is still too low for a weekly ROAS read to be trusted.
Or see what your team should look at first: the Paid Media Capacity Check, being built nowSo what do you do when the volume is not there?
Four things, none of which require more data than you have.
- Set the target from your margin, once, and write it down. Break-even plus whatever contribution the business needs. It is a business number, not a marketing number, and it should not move because last week was good.
- Set your review window by conversion count. "We review at 50 conversions" beats "we review on Mondays" in any account under a few hundred conversions a month. The calendar is not measuring anything.
- Write the expectation before the change, not after. One line: what you changed, what you expect, and the date you will look. Without it, you will read whatever happened as confirmation, which is the argument in you are deciding from memory.
- Give yourself explicit permission not to look daily. If the difference between today and yesterday is inside the band, opening the dashboard cannot inform a decision. It can only prompt one. Writing that permission down before the clock starts is the part of incrementality testing that nobody publishes.
- Put the band in the report, not just in your head. A client reading a 22% drop with no noise floor next to it will explain it, and so will anything they paste the report into. That is one of the eight lines in the marketing report template.
That last one is not theoretical
That last one is not theoretical. In early August 2026 an operator in r/FacebookAds was running a jewellery shop on about 58 dollars a day, with roughly 20 purchases in three weeks. He described the noise accurately himself. He said his main metric looked volatile. Then he spent a whole day moving things around, and finally asked the subreddit whether it was acceptable to give a change a week before judging it. He knew he had no volume. He still needed somebody else to authorise the wait.
And the honest counter-argument, because leaving it out would be selling.
A lot of operators solve this by asking the number for less. Google announced a bidding change in August 2026, and the top-voted reply in r/PPC was to set an ideal CPA or ROAS, let it run, and stop worrying. That is cheaper than everything above. It also works for the pain most people actually feel, which is a client asking why the number moved. It stops working the moment that number is wired to something that spends money on its own, which is what not to automate in your ad accounts.
Or see what your team should look at first: the Paid Media Capacity Check, being built nowWhat I still do not know
- I have not automated the order-value spread. The tables use a typical figure. The right one is computed per account from your own order values. Until a tool does that for you, the band on this page is an estimate with your name on it.
- Readable is not the same as caused. A difference large enough to clear the band still does not tell you what produced it. It tells you the difference was probably not chance. Everything after that is judgement.
- Lead generation breaks the arithmetic. When the conversion is a form and the revenue lands months later in a CRM you often cannot see, none of these tables apply cleanly. I know the volume argument still holds. I do not have a clean answer for what "good" means before the revenue exists.
Related reading. Average CTR on Facebook ads: the same borrowed-number problem, one metric earlier in the funnel. Measure ad effectiveness: which question a ratio like this one is allowed to answer. Marketing attribution: which conversions the ROAS is even counting. Marketing report template: how to hand the number to a client without handing over the argument. Google Ads change history: proving what changed before the numbers moved. Deciding from memory: why the expectation has to be written down first. What not to automate in your ad accounts: what happens when a noisy number gets wired to a rule.
What is a good ROAS?
A good ROAS is one that clears your gross margin with room left over. Break-even ROAS is 1 divided by your gross margin, so a 40% margin breaks even at 2.5 and a 70% margin breaks even at about 1.43. Anything below that loses money on every sale, whatever the industry average says.
How do I calculate my break-even ROAS?
Divide 1 by your gross margin as a decimal. A 35% margin gives 1 ÷ 0.35 = 2.86. Subtract shipping, payment fees and expected returns from the margin first, or the break-even point you calculate will be lower than the one your bank account uses.
Is a ROAS of 4 good?
Whether a ROAS of 4 is good depends entirely on your margin. At 60% gross margin, a ROAS of 4 leaves 35% of revenue as contribution, which is healthy. At 20% margin, break-even is 5, so a ROAS of 4 loses money on every order. The same number is a win in one account and a leak in another.
Why does my ROAS swing so much week to week?
Mostly because the conversion count is small. The random spread of a count scales with the square root of that count, so at 20 conversions per period a swing of 80% or more is ordinary. Low-volume accounts see enormous week-to-week ROAS movement with nothing changing in the account.
How many conversions do I need before I can trust a ROAS comparison?
For a 20% difference to stand clear of noise you need roughly 200 to 500 conversions in each period, depending on how much your order values vary. At 50 conversions you can see a halving. At 20 you can barely see a doubling. Below that the comparison is decoration.
Should I use industry ROAS benchmarks?
Use them for orientation, never as a target. A benchmark averages accounts with different margins, price points, attribution settings and conversion definitions. Two shops reporting the same ROAS can be one profitable and one dying, and the benchmark cannot see which is which.
What is the difference between ROAS and blended ROAS?
Platform ROAS divides the revenue that platform claims by the spend on that platform. Blended ROAS, or MER, divides all revenue by all marketing spend. Platform ROAS steers a campaign. Blended ROAS is the one that matches the bank, because no platform can double-count it.
Last updated:
Or see what your team should look at first: the Paid Media Capacity Check, being built nowWho wrote this
I am Manu. I have been buying media for eight years, and I got tired of platforms that hand back the same commentary the ad platform already shows you. So I started building an open-source console that reads my Meta and Google data and never changes anything I have not approved. It is Apache-2.0, with a runnable demo on synthetic data. If you want the conversion counts and the margin arithmetic run against your own accounts, the audit below does exactly that and changes nothing.