Measurement · Client reporting
Marketing report template
Most marketing report templates are a list of sections. This one starts with a definition header: the date basis, what counts as a conversion, the currency, and the smallest difference the account can actually read. Those eight lines are what stop the same month producing two different answers.
A report template is not a layout problem.
Search for one and you get a list of boxes. Executive summary. Channel breakdown. Top campaigns. Next steps. Fill them in and you have a document that looks like a report.
Then the client asks why conversions are down 22%, and your document cannot answer it. Not because a number is missing. Because nothing in it says what a conversion was, or which day the number landed on.
That gap got more expensive this year, for a reason nobody designed around.
Your report has a second reader now, and it does not know anything about the account.
Or see what your team should look at first: the Paid Media Capacity Check, being built nowWhat goes in a marketing report template?
Four blocks. A definition header that fixes what the numbers mean. A one-page summary written as sentences. A channel table with the raw rows. And a log of what changed in the account. Most templates ship only the middle two. The header is the part that stops the same month producing two different answers.
Here is the header. Eight lines, written once and updated when something in them changes.
| Header line | What you write in it | What it stops |
|---|---|---|
| Period and date basis | 1 to 31 July. Google Ads figures credited to click date, GA4 figures to conversion date | Best for stopping the two-tables argument. The same sale sits on two different days in the two systems, and neither is wrong |
| What counts as a conversion | Purchase only. Lead form and add to cart are tracked and excluded. One primary action, five others enabled and not counted | The single biggest source of a wrong number. Nobody can audit a conversion count without the definition next to it |
| Attribution model and window | Last click, 30-day click window, 1-day view. Unchanged since March | A model or window change that moves the figures while the account stands still |
| Currency | All values in EUR. The Meta account reports in USD, converted at the month-end rate | Two currencies added together into one total, which looks fine and is not |
| Source of record for revenue | Shopify. Platform revenue appears in the channel table for steering, never in the total | Double counting, when Meta and Google both claim the same order |
| Smallest readable change | 128 conversions this month. Month-on-month differences under about 35% sit inside the noise band | Best for killing invented causes. A reader who is not told the noise floor will explain every wobble |
| What changed in the account | Three changes, each with its date and the reason. Nothing else was touched | The month where something moved and nobody can say what you did |
| What this report cannot see | No CRM access, so lead quality and closed revenue are not in here | Somebody filling the gap for you, usually with a guess |
The three blocks under it, and why the order matters
Then the three blocks under it, and the order matters more than the contents.
- The summary, in sentences. Three to six of them. What happened, what you think caused it, what you did about it, and what you will do next. No charts in this block. If a sentence cannot be defended in a meeting, it does not go in.
- The channel table, raw. Spend, clicks, cost per click, conversions, cost per conversion, conversion rate, impression share, and share lost to budget or rank. One row per channel, one per campaign underneath. No commentary in the cells.
- The decisions log. One line per change: date, what you changed, what you expected, and the date you will check it. This is the block that turns next month's report into an answer instead of a story.
The header and the decisions log are the two that almost nobody sends. They are also the two that cost nothing to produce, because you already know both.
Or see what your team should look at first: the Paid Media Capacity Check, being built nowWhy does the same month give two different numbers?
Because the two systems credit the sale to different days, and to different clicks. This is documented behaviour, not a bug in your setup, and it is the first thing the header disarms. Google explains both halves of it in one place.
“Google Ads reports conversions against the date/time of the click that led to the conversion. Analytics uses the date/time of the conversion itself.”
“Google Ads uses the last Google Ads click, but Analytics uses the last click across all channels.”
Google Analytics Help, Data discrepancies between Ads and Analytics (retrieved 12 August 2026)
So a sale on 2 August from a click on 30 July is a July sale in one report and an August sale in the other. Put the two tables side by side without saying which basis each uses, and you have handed your client a contradiction to solve.
The date is only one of four dials
The date is only one of four dials. Which conversion counts, which model, which window and which date all move the number without anything happening in the account. That is the argument in marketing attribution, and it is why the header exists at all.
Three of these I found in real accounts
Three of these I found in real accounts while building the console that reads them.
- One primary conversion action, five more enabled in the same category. Every one of them a form. The reported count was a sum nobody had chosen.
- Six GA4 key events with four different names for the same thing, which was somebody filling in a form. Any report built on that count is reporting a naming accident.
- Conversion values in more than one currency, with one action that had no currency defined at all. The total added up cleanly and meant nothing.
None of those is exotic. They were in ordinary accounts run by people who know what they are doing. The header does not fix them. It stops you shipping them silently.
Or see what your team should look at first: the Paid Media Capacity Check, being built nowWho is this report actually for?
Two readers want opposite things from the same file, and most templates quietly pick one. The operator needs a sentence that holds up in a meeting. The client who pays needs clean rows to put next to their own sales data. Send the second one a narrative and it reads as padding.
| The operator sending it | The client paying for it | |
|---|---|---|
| What they are buying | An explanation of the month that survives being questioned | Numbers they can join to their own revenue |
| Hardest part for them | Putting a bad month into words a business owner accepts | Working out which of your figures is comparable to theirs |
| What annoys them | A wall of screenshots that answers nothing | Length, decoration, and charts in place of rows |
| Serve them with | The summary block. Sentences, with the decisions log behind them as evidence | The channel table plus the header. Raw rows, and the terms that make them joinable |
Both halves come from operators talking to each other in public, not from a survey.
In August 2026 someone running Meta ads for a handful of clients posted in r/FacebookAds that the data was never the hard part. The narrative was. Explaining to a business owner why their cost per lead went up, in words they accept, was harder than running the ads. His current method was screenshots from Ads Manager pasted into a doc with notes underneath, which he described as working but feeling amateur.
And the other buyer, the same week
The same week in r/PPC, someone who introduced himself as a client rather than an agency said the opposite. He did not want a 35-page report. He said charts and graphs clutter it. What he wanted was cost, cost per click, conversion rate and impression share, including how much was lost to rank or to budget. His last line is the one worth pinning up: the information is only useful when he combines it with his sales data.
Neither of them is wrong. They are two buyers, and the deliverable is not the same. A template that does not say which reader a block is for will underserve both.
The way out is not two documents. It is one document where the narrative and the rows are separated cleanly enough that either reader can skip the other half.
One honest note on that evidence. These are people who post in public, which is not a sample of the market. Nobody was interviewed. Two of the three positions here rest on a single voice each.
Or see what your team should look at first: the Paid Media Capacity Check, being built nowWhat happens when your client pastes the report into ChatGPT?
ChatGPT answers, and it answers with confidence, because it has no way to know what it is missing. The gaps in your report get filled with generic priors about advertising. What comes back to you is not a better question. It is a wrong cause you now have to disprove in writing.
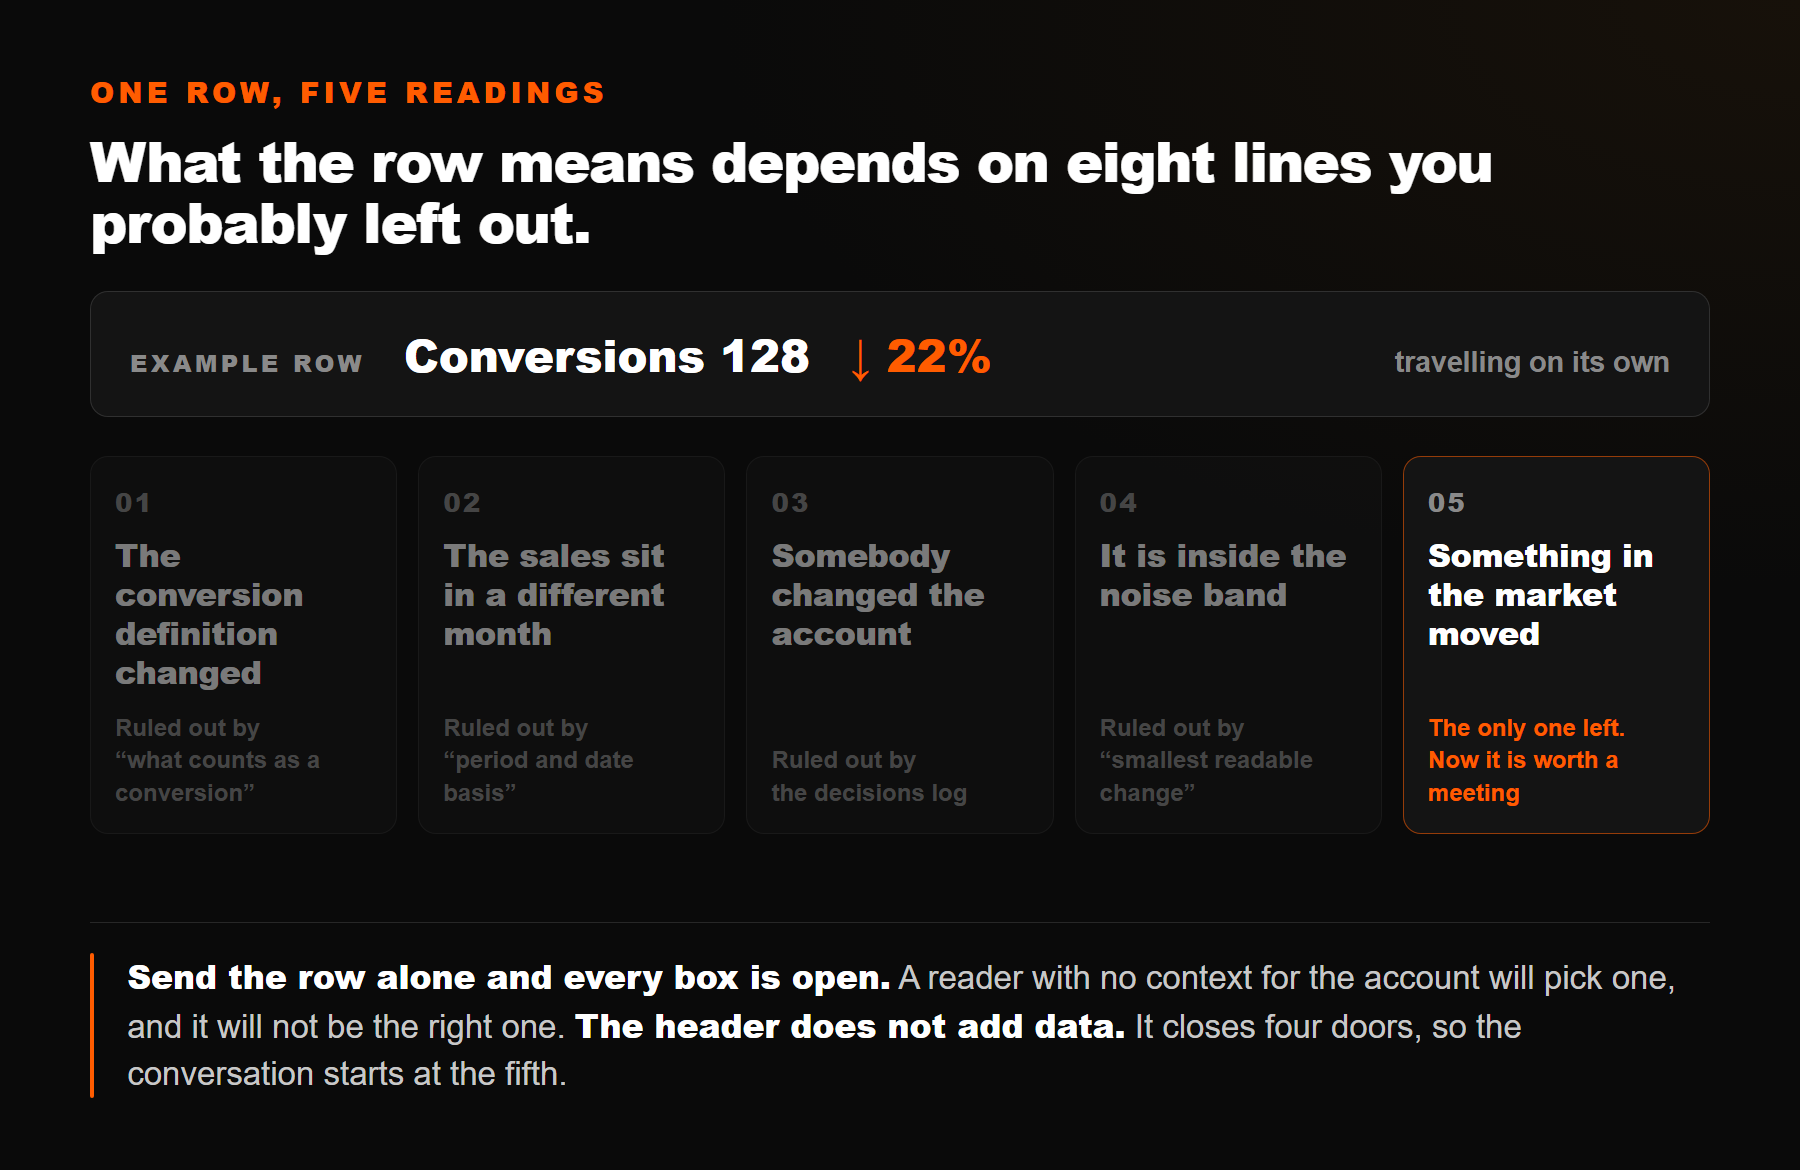
None of that is a prediction. Three operators described it independently in one r/PPC thread in August 2026, and the top-voted comment in the thread was the plainest.
What three operators described, in their words
Clients are barely reading the report, he wrote. They are putting it into Claude or GPT and coming back with questions built on nothing, like why a prospecting campaign is not producing revenue. A second operator called it a plague. A third put a price on it. Hours spent writing an email to explain why the model's suggestion was wrong, no acknowledgement of the email, and often a cancellation shortly after.
You cannot stop this and you should not try. Your client is allowed to check your work.
What you can do instead
What you can do is make the document hard to misread when it travels alone. Every header line above closes one gap that a model would otherwise fill.
- The noise floor is the highest-value line. A model asked why conversions fell 22% will always find a reason. Told that anything under 35% is inside the band for this volume, it has nothing to explain. The arithmetic behind that number is in what is a good ROAS.
- The conversion definition stops the wrong benchmark. Without it, a model compares your purchase-only count against ecommerce averages that include leads and add-to-carts.
- The decisions log answers the question before it is asked. Most of the invented causes are guesses about what you did. Listing what you did removes the guess.
- The line about what the report cannot see is the one that protects you. A model will not volunteer that lead quality is unmeasured. It will just answer as though it were measured.
The cheaper version, and who it is for
There is a cheaper version of all this, and plenty of people run it: send less, explain nothing, and handle the questions when they come. That works while the client is not running your numbers through anything. It stops working the first time they do.
Or see what your team should look at first: the Paid Media Capacity Check, being built nowWhat this cost me to learn
In 2025 I spent more than 10,000 euros of my own money on ad management platforms. Not a client's money. Mine.
What came back was the commentary Google and Meta already show inside their own interfaces, wrapped in a nicer report. Generic rules, applied identically to every account. Not one of them ever printed the terms the numbers were computed under. They printed the number and a trend line.
Two more, from building the thing instead of buying it.
What the first import returned
The first time I pulled change history into our own console, it returned four identical rows. Same day, same wording, empty old and new values, HTTP 200 the whole way. The obvious diagnosis was stale data, and the obvious diagnosis was wrong: the same campaign was arriving with two different references across imports, so the join silently returned nothing. A "what changed" block can be empty because nothing changed, or because your query is broken, and those look identical on a page. That whole scar is in Google Ads change history.
The second is worse, because it is a report that lies by being tidy. Our measurement query has a fallback that drops the attribution model, the value settings and the lookback windows when an account does not return them. The screen stays clean. It just knows less than it looks like it knows. I wrote the fallback. I still nearly trusted the output.
The last one is not technical. The client hires you so they can stop thinking about this, and then does not give you CRM access. You report lead volume and cost because that is what you can see, and you get judged on lead quality, which you cannot. The only honest move I have found is the header line: say what the report cannot see, in the report.
What I still do not know
- Whether one document really serves both readers. I send one file and let each reader skip the half they do not want. Two files would serve each better and would drift apart within three months. I have not tested the second option properly.
- What the client's model actually did with it. I can only see what comes back in the reply. Making the document harder to misread is a reasonable bet, not a measured result.
- How to price the noise floor honestly in lead gen. When the revenue lands months later in a CRM you cannot see, the smallest readable change is not computable from the report. I write the limit down. I do not have a better answer than that.
- Whether the header survives contact with a client who does not want it. Eight lines of terms at the top of a report can read as hedging. So far, saying it out loud has gone better than not saying it. That is one operator's experience, not evidence.
Related reading. Marketing attribution: the four dials that move the number while the account stands still. What is a good ROAS: where the noise floor in the header comes from. Google Ads change history: how to know what actually changed before you report it. Deciding from memory: why the decisions log has to be written before the result, not after. Export Google Ads data: how to know the file under the report adds up before you build on it.
What should a marketing report template include?
Four blocks. A definition header that fixes what the numbers mean. A one-page summary written as sentences. A channel table with the raw rows. And a log of what changed in the account. Most templates ship only the middle two, which is why the same month can produce two different answers.
What is a definition header in a marketing report?
Eight short lines at the top that fix the report's terms. Period and date basis. What counts as a conversion. Attribution model and window. Currency. Source of record for revenue. The smallest change the account can read. What changed in the account. And what the report cannot see.
Why do Google Ads and GA4 show different conversion numbers for the same month?
Because they credit the sale to different days and to different clicks. Google Ads Help states that Google Ads reports conversions against the date of the click, while Analytics uses the date of the conversion itself. It also states that Google Ads uses the last Google Ads click while Analytics uses the last click across all channels.
How long should a client marketing report be?
Short enough that the summary fits on one page. A client posting in r/PPC in August 2026 said a 35-page report is unwanted and that charts clutter it. What that reader wanted was cost, cost per click, conversion rate and impression share, in rows he could join to his sales data.
What happens when a client runs your report through ChatGPT?
ChatGPT fills the gaps with generic priors, because it has no context for the account. Three operators in one r/PPC thread in August 2026 described the same result: questions built on invented causes, and hours spent explaining why the suggestion was wrong. A definition header removes most of the gaps it can invent into.
Should I send a client a dashboard or a report?
A report, if you want it read. An r/analytics thread in August 2026 described dashboards as a graveyard: requested, built, opened twice, then abandoned. A dashboard shows a current state and answers nothing. A report states a period, a claim, and the evidence for it.
How do I report lead quality when the client will not give me CRM access?
You say so in the report, on its own line. Without the CRM you can report volume, cost and form completion, and you cannot report what closed. Writing that limit into the header is the only honest option, and it stops the gap being filled by somebody else.
Last updated:
Or see what your team should look at first: the Paid Media Capacity Check, being built nowWho wrote this
I am Manu. I have been buying media for eight years, and I got tired of reports that print a number without printing the terms it was computed under. So I started building an open-source console that reads my Meta and Google data and never changes anything I have not approved. It is Apache-2.0, with a runnable demo on synthetic data. If you want the header above filled in against your own accounts, the audit below does exactly that and changes nothing.