Measurement · Incrementality
Incrementality testing
Incrementality testing answers one question: how many of these sales would have happened anyway. You hold a group back, run the ads at everyone else, and read the gap. Google recommends 4 to 6 weeks for an experiment. The button that ends it early is available on day three, and ending is the only action here you cannot undo.
Every guide on this topic teaches you how to design the test.
Almost none teach you how to keep it alive for six weeks.
Keeping it alive for six weeks is the part that fails. Not the maths.
Two operators said it out loud, and neither named it
Same week last summer, on r/analytics. One asked it as a question, addressed to nobody in particular:
“Curious if you’ve had geo tests survive contact with a real budget or if they die in the org before they finish.”
u/WickedReports, r/analytics, July 2026. Collected in our own ICP voice bank.
The other answered it without meaning to, in a different thread:
“I wholeheartedly disagree with this, but that’s what the management wants and I cannot fight them (I tried).”
u/trp_wip, r/analytics, July 2026. Same voice bank.
Nobody in either thread proposed a fix
The subject came up and moved on, because there is no accepted name for this failure and therefore nothing to look up.
So this page is in two halves. The first is the standard material, kept short. The second is the part nobody publishes: what you write down on day zero so that a bad Tuesday in week two stays a bad Tuesday.
What is incrementality testing?
Incrementality testing measures how many conversions the advertising actually caused, by holding a group back on purpose. One group sees the ads. A comparable group does not. The gap between them is the incremental result, and everything else in your reporting is a guess about that gap.
The arithmetic is not the hard part:
Incremental conversions and lift
The last line is the one worth staring at. Your incremental CPA is always worse than your reported CPA, sometimes by a lot, because the reported one is being credited with sales that were coming anyway. That is not a tracking error. It is the difference between two questions.
There are four ways to hold a group back, and they are not interchangeable.
| Method | What is held back | What it costs you | Best for |
|---|---|---|---|
| Platform experiment (Google Ads experiments) |
A split of the same campaign’s traffic, control against treatment | Nothing extra. The budget is already being spent | Comparing two settings. Bidding, match types, a landing page. It answers “which of these two”, never “is any of this working” |
| Geo holdout | Whole regions, switched off for the duration | Real revenue in the dark regions, for weeks | The honest answer to “is this channel worth it”. Slow, expensive, and the only version most finance teams will believe |
| Platform lift study (conversion or brand lift) |
A share of the audience the platform selects and manages | Usually a minimum spend, plus the control group’s lost sales | Speed. Easiest to launch. Hardest to audit, because the platform builds the control group and then grades the result |
| Switch it off and watch | Nothing. Time is the only variable | Feels free. It is not | Almost nothing, and it is what most people actually do. Seasonality, pricing and every other change ride along inside the result |
Note what the first row cannot do. A campaign experiment splits traffic that was going to be bought either way, so it compares two versions of spending the money. It never compares spending to not spending. Plenty of reports labelled incrementality are running that first row.
Why can’t attribution answer this?
Because every conversion in your attribution data was exposed to the ads. There is no unexposed group in there to compare against. Attribution distributes credit across the touchpoints it can see, using a model and a lookback window that you chose. Change either and the same week produces a different number, without a single thing happening in the account. That is the whole argument in marketing attribution.
So attribution can tell you which channel to credit. It cannot tell you which channel to keep.
What comes before the test design?
The first job is not the test design. The first job is deciding which question was asked, because a holdout is the expensive answer to only one of three. That sorting step is written out in how to measure ad effectiveness.
This gap got wider in 2026, not narrower. Broad, keywordless matching means the platform decides more of what you buy, and the reporting on that decision is split across views the platform tells you not to add up. We wrote that out for the September migration in the AI Max auto-upgrade. When the report cannot be reconciled, holding a group back is what is left.
How long does the test have to run?
Longer than anyone expects, and the platform says so itself.
“It’s recommended that you run the experiment for at least 4-6 weeks or longer if you have a long conversion delay.”
Google Ads Help, Experiments FAQs (retrieved 26 August 2026). The same page recommends waiting for one to two conversion cycles.
Can your account resolve the effect at all?
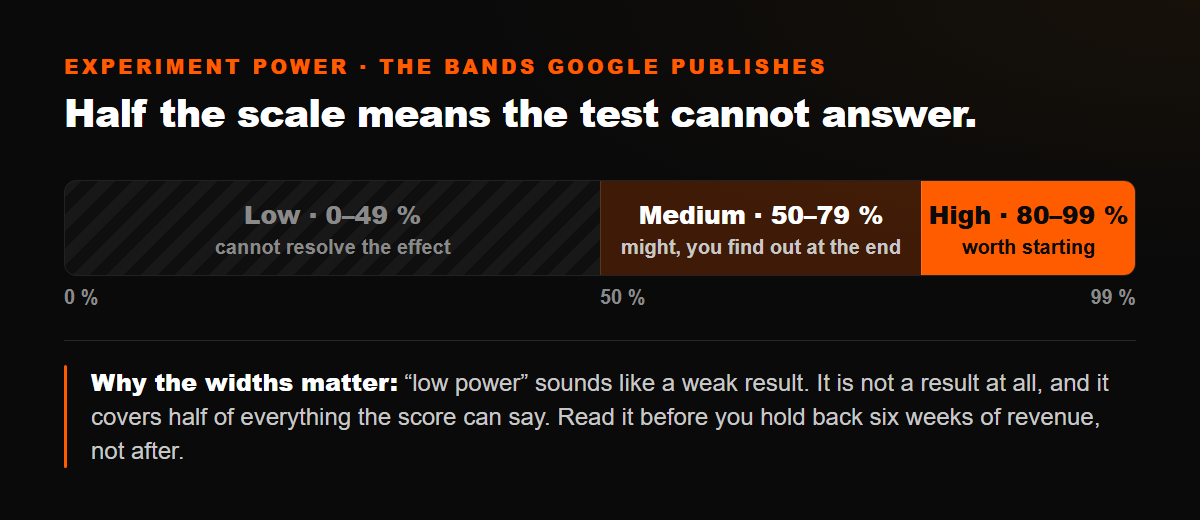
Google publishes a score for that, before you start. Experiment Power is calculated from historical spend, conversions, expected uplift and duration, and the bands are blunt:
- Low, 0 to 49 percent. Not a warning that the result will look weak. It says the test cannot resolve the effect you are looking for, so you will finish six weeks later knowing nothing.
- Medium, 50 to 79 percent. It might resolve, and you will not find out which until the end. This is the band where writing the inconclusive branch of the decision rule stops being optional.
- High, 80 to 99 percent. Worth starting. Everything on this page from here down is about surviving the wait.
Underneath that sits the same arithmetic as any other measurement question. The smallest difference you can distinguish shrinks with the square root of your conversion count, so below roughly 50 conversions per side you can only see very large effects. The table of thresholds is in what is a good ROAS, and it applies here unchanged.
Which produces the uncomfortable first step. Before designing anything, work out whether your account can produce a readable answer in the time you have. Sometimes it cannot, and knowing that on day zero is worth more than six weeks of held-back revenue.
The bar it gets graded against
When the verdict arrives, Google grades it against a fixed one. Its methodology page puts it in one line: “Two-tailed significance testing is then run using the 95% confidence interval”. That is from The statistical methodology behind experiments, retrieved 26 August 2026. The bar does not move because your quarter ends on Friday.
The one control in an experiment you cannot take back
Here is the thing I have not seen written down anywhere, and it is sitting in the help docs. Two controls, side by side, and only one of them can be taken back.
| The control | What Google’s documentation says | Can you undo it? |
|---|---|---|
| Extend the end date | The end date can be pushed “at any time during the experiment, up to a maximum of 12 weeks from the current date” | Yes, as often as you like. Patience has unlimited undo |
| End now | “Your experiment will finish at the end date, or you can finish the experiment manually before the end date when you select End now” | No. “After the experiment ends, you can’t resume it or edit the end date” |
Both quotes are from Find and edit your experiments, retrieved 26 August 2026.
Two buttons that look the same
The irreversible one is the one an anxious stakeholder asks for in week two. Nothing marks it as the point of no return, because to the product it is just a status change.
Why week two is when the pressure arrives
Week two is not psychology. It is the ramp-up. The early days of an experiment are volatile by construction, so that is precisely when the chart looks alarming and somebody starts watching it daily. The statistics literature has a name for what daily watching does:
“A/B tests are typically analyzed via frequentist p-values and confidence intervals; but these inferences are wholly unreliable if users endogenously choose samples sizes by continuously monitoring their tests.”
Johari, Pekelis and Walsh, Always Valid Inference: Bringing Sequential Analysis to A/B Testing, arXiv:1512.04922 (v3, 16 July 2019).
Nobody in this story is the villain
Read that as an operator, not as a statistician. It does not say your organisation is undisciplined. It says that letting the watcher decide when to stop breaks the test mathematically, however well intentioned the watcher is. The person asking for a daily update is not the villain here. The missing decision rule is. Which is the whole fix, and it fits on one screen. Write it before the test starts. Paste it where the team can see it, and hand it to the next person who asks how the test is going.
What to write down before the test starts
Test charter. Filled in before the test starts, not after
The branch everyone leaves out
The branch everyone leaves out is the third one in the decision rule. In a small account, inconclusive is the most likely outcome. If nobody agreed in advance what happens then, the argument you were trying to avoid arrives anyway, with six weeks of sunk cost attached. And the last line of the charter matters for a reason that took me a while to understand. It is the next section.
What this cost me to learn
In 2025 I spent more than 10,000 euros of my own money on ad management platforms. Not a client’s money. Mine.
What they returned was the commentary Google and Meta already show you inside their own interfaces, plus generic rules applied identically to every account. Not one of them ever asked whether the account could answer the question I was asking it. None of them kept a record of what I had changed while I was asking.
That second gap is the one I ended up building for, and it is where I hit something I did not expect.
Six weeks is forty-two days. The API remembers thirty.
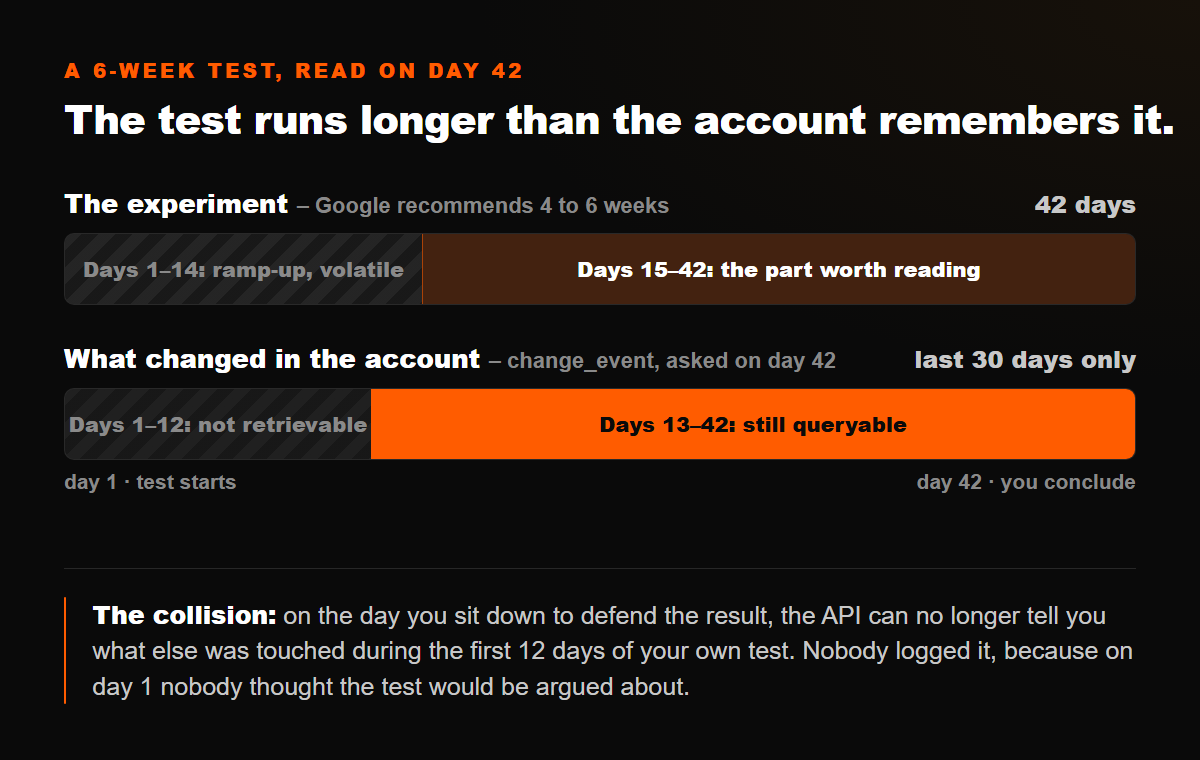
Google recommends 4 to 6 weeks for an experiment. The Google Ads API resource that tells you what changed in the account, change_event, must be filtered to the past 30 days and capped at 10,000 rows per query. There is no backfill. The interface keeps two years of change history, the API keeps thirty days, and the gap is not recoverable by any tool you connect.
Six weeks is forty-two days. Forty-two minus thirty is twelve. On the day you sit down to defend the result, nothing can tell you what else was touched in the first twelve days of your own test. We wrote the mechanics of that window up separately in Google Ads change history.
How I found out, which was not cheap
Building the change-history import. The first run pulled four identical rows, and the before-and-after impact sat on “measuring” forever because the same campaign arrived with two different internal references across two imports. The join returned nothing and said nothing. The obvious diagnosis, stale data, was wrong.
The lesson generalises past our tooling. A test is a claim about a period, and the account’s own memory of that period expires while the test is still running. So the charter has a line for where the start gets logged, and the answer cannot be “the platform remembers”. It does not. This is the same argument as deciding from memory, one level up: the account forgets too.
What to do when the organisation is the variable
Five things, in the order they actually help.
- Check readability before you design anything. Conversions per side, not weeks. If the account cannot resolve the effect you care about, say so on day zero and propose something cheaper. A test that was never going to answer is worse than no test, because it burns the credibility of the next one.
- Name the person who can end it, in writing, before it starts. One name. Everyone else who asks gets shown that line. This sounds bureaucratic and takes ninety seconds, and it converts a live argument into a settled one.
- Publish the ignore-until date with the start date. If the first two weeks are ramp-up, say so up front. Then a scary week-one chart is an expected event instead of new information.
- Write the inconclusive branch. What happens if the answer is “we cannot tell”. Most small-account tests land there, and it is the only outcome nobody plans for.
- Log the start and every mid-test change somewhere that is not the platform. A dated line per change. Thirty days from now the API will not have it, and you will be asked.
The honest counter-argument
Leaving this out would be selling.
Most operators do not want any of this. When Google announced a bidding change in August 2026, the top-voted reply in r/PPC was to set an ideal CPA or ROAS, let it run, and stop worrying. Our own ICP research has logged that pattern nine separate times across four subreddits. Faced with a measurement that is expensive or awkward, the popular move is to lower what you ask of it. Not to fix it. In r/agency the same reflex shows up as dropping the metric entirely.
Setting a target and leaving it alone is a rational trade, and it works for the pain most people actually feel, which is a client asking why a number moved. It stops working in exactly two situations. When the number is wired to something that spends money on its own, which is what not to automate in your ad accounts. And when somebody is deciding whether to keep funding the channel at all. Incrementality is for the second one. If nobody is asking that question, do not spend six weeks of held-back revenue answering it.
What I still do not know
- I could not verify Meta’s A/B testing documentation directly today. Its help pages did not return readable text to the tools I used, so everything quoted on this page is from Google’s docs and one academic paper. I would rather say that than paste a Meta minimum I have not read at the source.
- The charter is a practice, not a measured result. I use it and it has stopped arguments in my own accounts. I have not run it against a control group of teams that did not use one, so treat it as a working procedure rather than evidence.
- I do not know the right geo holdout size for a small account. The published guidance assumes volumes most independent operators do not have. Below a certain spend I suspect the honest answer is that geo testing is not available to you, and I cannot yet say where that line sits.
- Readable is still not the same as caused. A holdout gives you a much cleaner causal claim than attribution does. It does not tell you which part of the change produced the effect, and that gap is judgement.
Related reading. Marketing attribution: why every tool gives you a different number for the same week. What is a good ROAS: the conversion volume that decides whether any comparison is readable. Google Ads change history: the thirty-day window, and why there is no backfill. AI Max auto-upgrade: the reporting split that pushed us here. Deciding from memory: writing the expectation down before the result arrives.
What is incrementality testing?
Incrementality testing measures how many conversions the advertising actually caused, by holding a group back on purpose. One group sees the ads, a comparable group does not, and the gap between them is the incremental result. It is the only method that separates sales you bought from sales you would have had anyway.
How is incrementality different from attribution?
Attribution assigns credit for conversions that already happened, using a model and a lookback window you chose. Incrementality asks what would have happened with no ads at all. Attribution can never answer that, because every conversion in the data was exposed. Only a held-back group creates the missing comparison.
How long should an incrementality test run?
Google Ads Help recommends at least 4 to 6 weeks, longer if your conversion delay is long, and suggests waiting for one to two conversion cycles. The first one to two weeks are ramp-up and usually too volatile to read. Plan the read date at the start rather than deciding it later.
What is a holdout group?
A holdout is the share of your audience, geography or budget deliberately excluded from the ads for the length of the test. It is the control. Holding it back costs real revenue, and that cost is the price of the answer. A test with no holdout is a before-and-after comparison wearing a better name.
Can I run an incrementality test on a small account?
Often no, and it is better to know that first. The smallest difference you can distinguish shrinks with the square root of your conversion count. Under roughly 50 conversions per side you can only see very large effects, so a small account can run a perfect test and still end with no readable answer.
Why do incrementality tests get stopped early?
Because somebody with authority watches the daily numbers during the volatile phase and reacts. Continuous monitoring is a known statistical problem, not a discipline problem. The fix is procedural: write the end date, the decision rule and the person allowed to stop it before the test starts.
Do I need a platform lift study or can I run this myself?
A platform lift study is easier to launch and harder to audit, because the platform builds the control group and grades its own result. A geo holdout or a campaign experiment you configure yourself is more work and gives you the raw numbers. For a test that has to survive an argument, run the one you can show your working on.
Last updated:
Who wrote this
I am Manu. I have been buying media for eight years, and I got tired of platforms that hand back the same commentary the ad platform already shows you. So I started building an open-source console that reads my Meta and Google data and never changes anything I have not approved. It is Apache-2.0, with a runnable demo on synthetic data. If you want the conversion counts and the change log run against your own accounts before you design a test, the audit below does exactly that and changes nothing.